Size, speed, and film are the absolute staples of scouting football players. Increasingly, analytic products are being used to augment traditional evaluations by coaches and staffs to increase the volume and improve the efficiency of player assessments. The most popular analytics attempt to quantify athleticism, strength, and speed – all necessary components for a player to succeed. Missing, are metrics to show whether those athletic attributes translate to on-field production…until now.
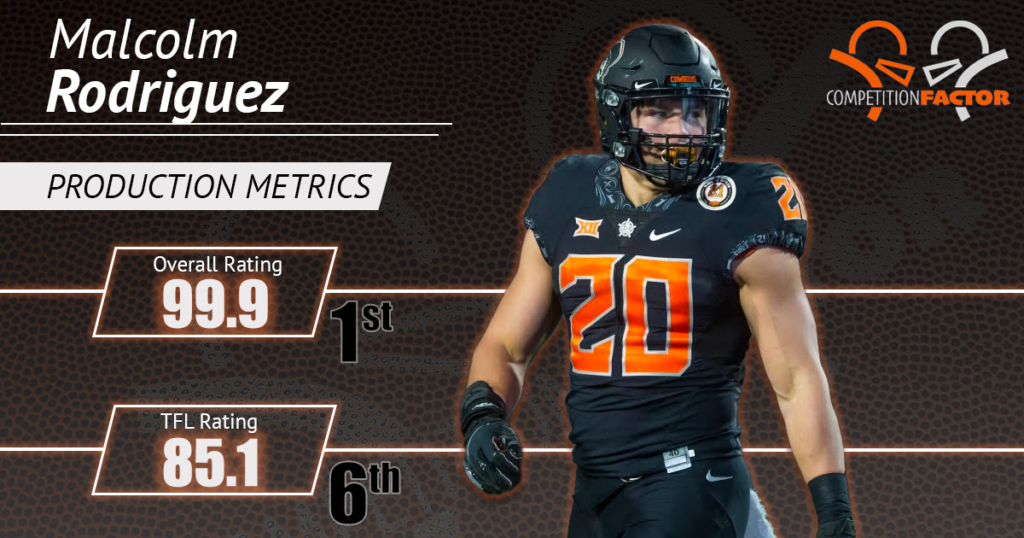
Our propriety analytic, called the Competition Adjusted Production Score (CAPS), rates and evaluates a player’s game-by-game production, indirectly measuring athleticism by focusing directly on how it translates to game performance. CAPS has proven to better predict a player’s true potential at the next level – pro potential for college athletes and college potential for high school athletes. The CAPS analytic is completely objective and unbiased. It predicts whether the player will perform at the next level, not simply if they will be drafted early or recruited by a Power 5 program. For instance, our top linebacker in the 2022 NFL draft class was Oklahoma State’s Malcolm Rodriguez. Our data indicates he will be very productive in the NFL, despite being drafted in the sixth round by the Detroit Lions.

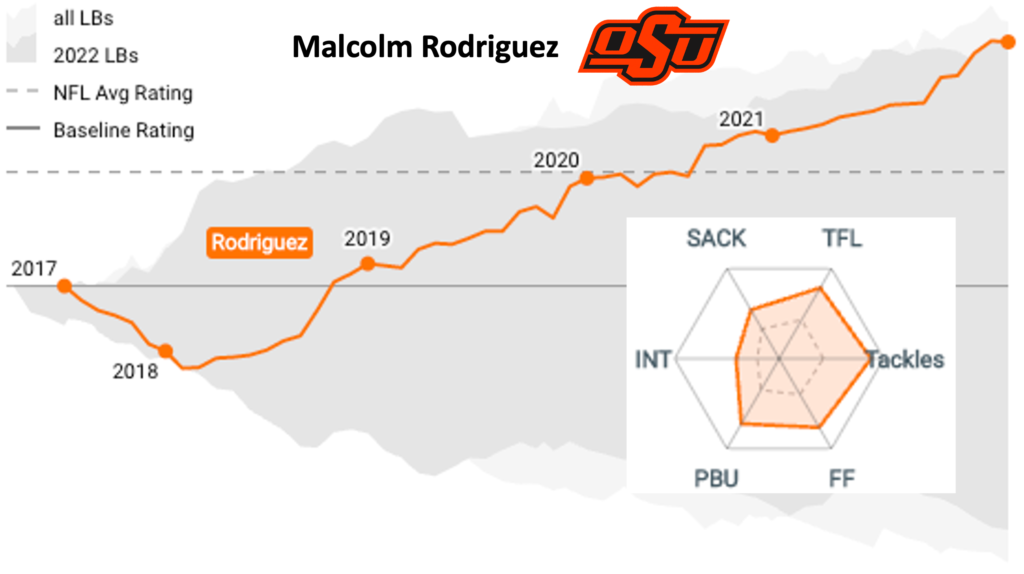
The CAPS analytic provides a new form of football player analysis. We evaluate players game-by-game, assessing their performance in a variety of position-relevant categories and accounting for the strength of each of their opponents. An individual’s CAPS rating (or grade) evolves over the course of their college/high school career. We update all player (and team component) ratings after each game and their current grade (overall and for positional metrics) is reflected in the tool. Our performance curves show a player’s rating over time similar to a stock value graph. Dots represent season breaks. The gray area represents the envelope of other players’ performance curves at that position. The dotted line is the average final rating for all linebackers who have been productive in the NFL (not simply drafted).

How it works
All players start with the same initial CAPS rating. For each game, a player has an expected performance based on his current rating and that of his opponent (behind the scenes, team components are rated game-by-game as well). If the player performs as expected, the player’s rating stays the same and the curve stays flat. If the player performs better than expected, then his rating (and curve) rises accordingly. A sub-par performance against an opponent will lower a player’s rating and his curve will fall.
Our analysis results in an overall player CAPS grade based on a number of position specific grades. Over the course of a high school or college career, our analysis identifies the players most likely to succeed at the next level. As an example, consider our ratings of Hunter Johnson and Trevor Lawrence, both ranked by ESPN as the #1 pocket passer in 2017 and 2018 respectively. Both had the exact same college opportunity, enrolling at Clemson and competing for QB1 against Kelly Bryant. Johnson struggled in college, while Lawrence performed extremely well and became the first overall pick in the 2021 NFL Draft.

Objective insurance
Misses with early draft picks and, now with NIL, big college recruits are costly – financially and even from a job security perspective. Because scouting and recruiting are such personal experiences, it is easy to become emotionally invested in a prospect. Comprehensive analysis of a player’s entire body of work without any bias is hard. Competition Factor offers added insurance that the players your franchise/program is investing in will meet expectations. If our rating matches your scouting – perfect. If not, more player analysis may be worthwhile. Consider three of the QBs selected in the first round of the 2020 NFL Draft below.

With the success of Patrick Mahomes, Lamar Jackson, and Deshaun Watson, it is easy to see how other franchises wanted to find similar dual threat athletes in future draft classes. Competition Factor can help identify the next version of these superstars.

Deeper insights
Dive deeper into a player’s game-by-game competition factor adjusted production to see what opponents pose the biggest challenge. For instance a QB is measured against the opponents pass defense, not the general team – we focus on things like the secondary, the pass rush, etc. Below you can see Drew Lock’s senior season in detail. He bounces around the NFL average line then finishes strong. This view can be used to quickly identify his best and worst game performances – pointing scouts to film that might best analyze the good and the bad. Looking specifically at Lock’s senior season, he underperformed our expectations against Georgia, South Carolina, Alabama, and Kentucky – all teams that had a strong defensive line and tended to pressure the quarterback. This suggests that Lock may struggle under pressure, which, in fact, proved true during his tenure with the Broncos.

Identify ‘below the radar’ talent
Our competition factor adjusted ratings enable comparisons across all levels of football. That factored production indirectly accounts for size, speed, and athleticism, but doesn’t eliminate players that simply don’t meet a certain standard. Our system has identified many players that weren’t drafted but proved their ability to perform at the next level – James Robinson, Austin Ekeler, Cole Beasley, Doug Baldwin, Kendrick Bourne, and Shaquil Barrett to name a few. Big names from lower divisions also rise to the top in the system – Jimmy Garoppolo, Cooper Kupp, Chase Edmunds, Tarik Cohen, Dallas Goedert are some notable examples.
See for yourself
Check out your favorite players and see how they compare with others in their position. Just visit our online draft tool at draft.competitionfactor.com. Currently we only expose FBS players publicly and we update the ratings weekly during the football season.
